Source language: Turkish
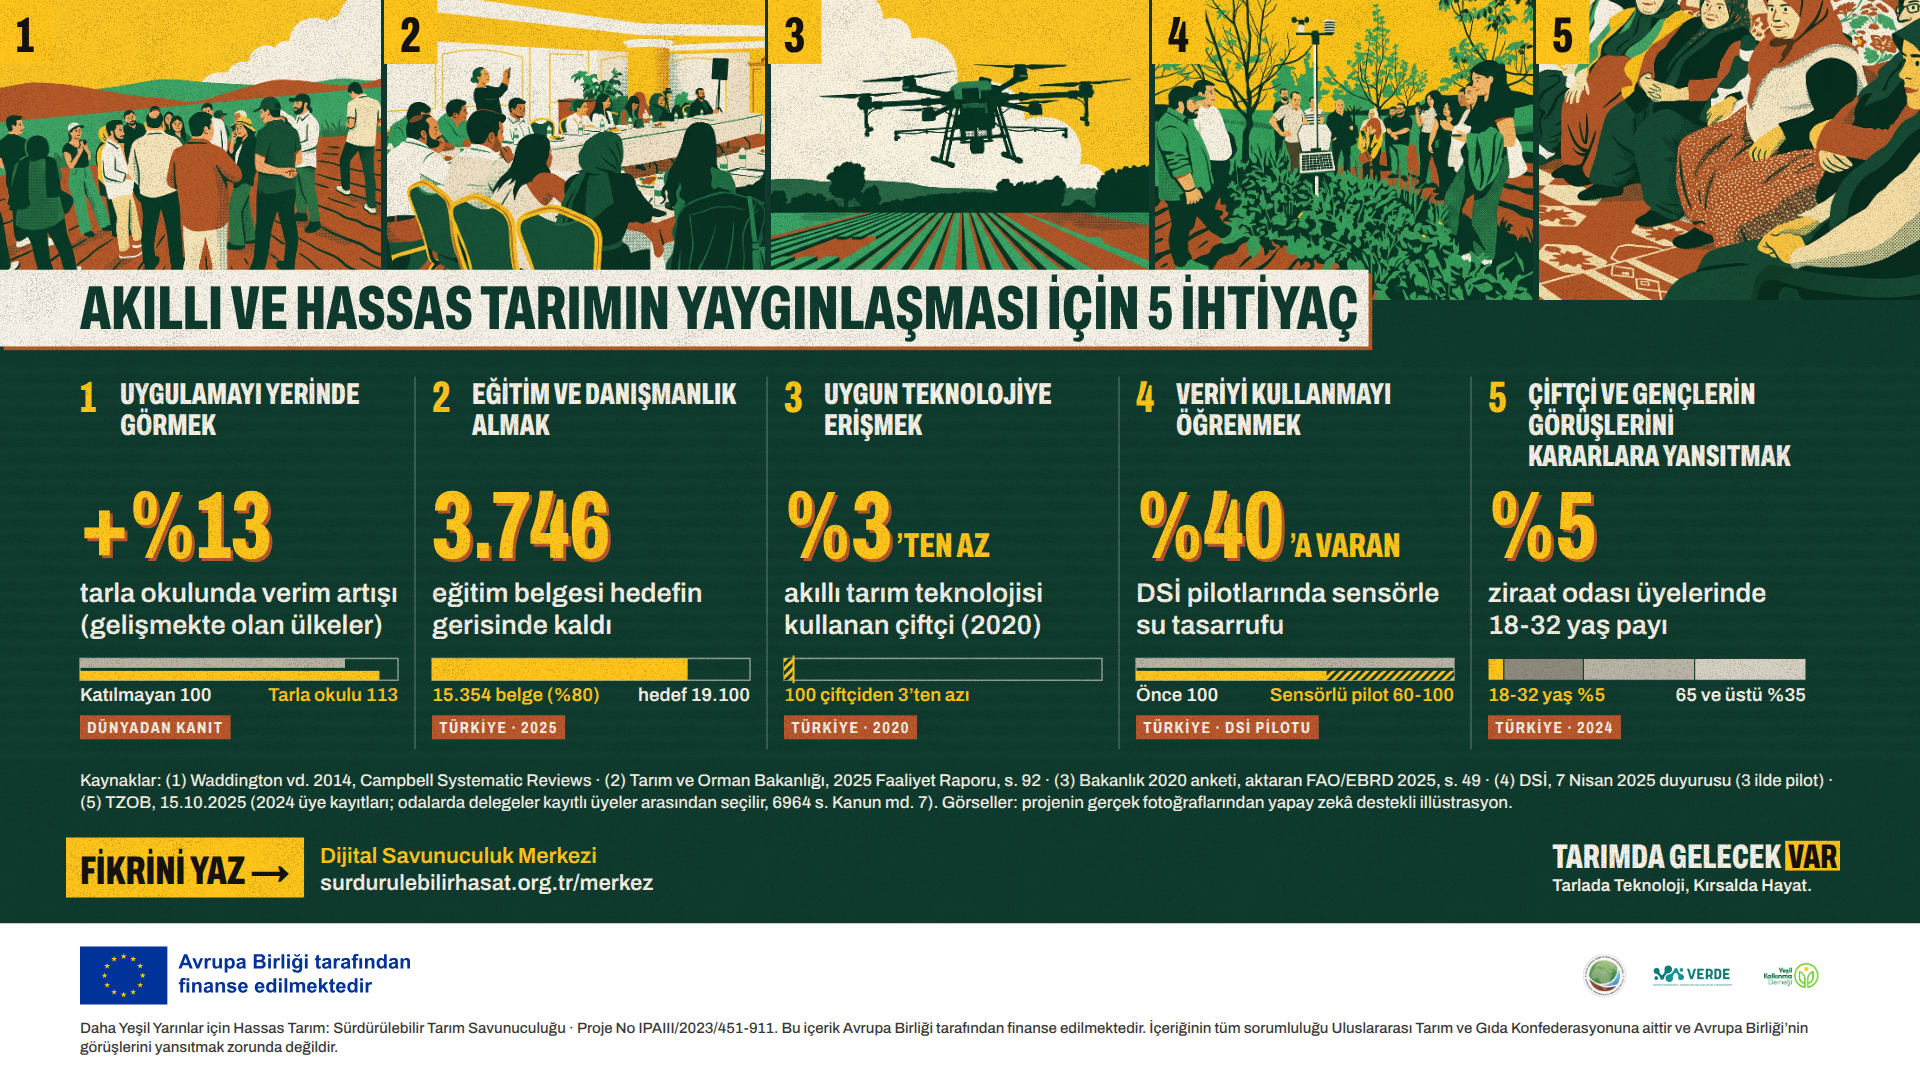
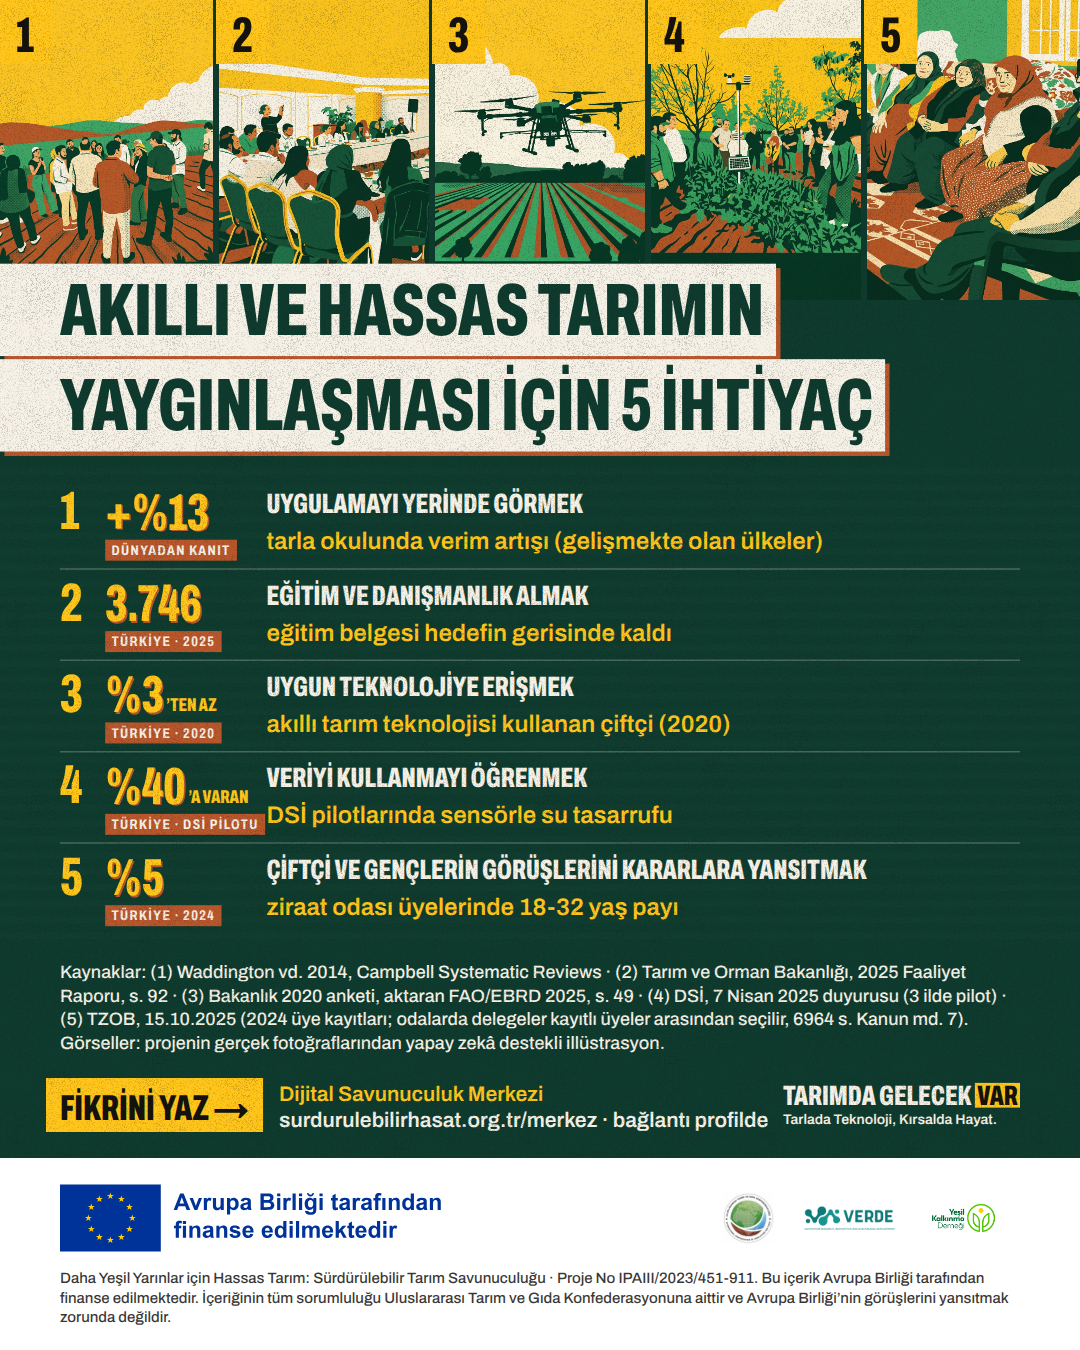
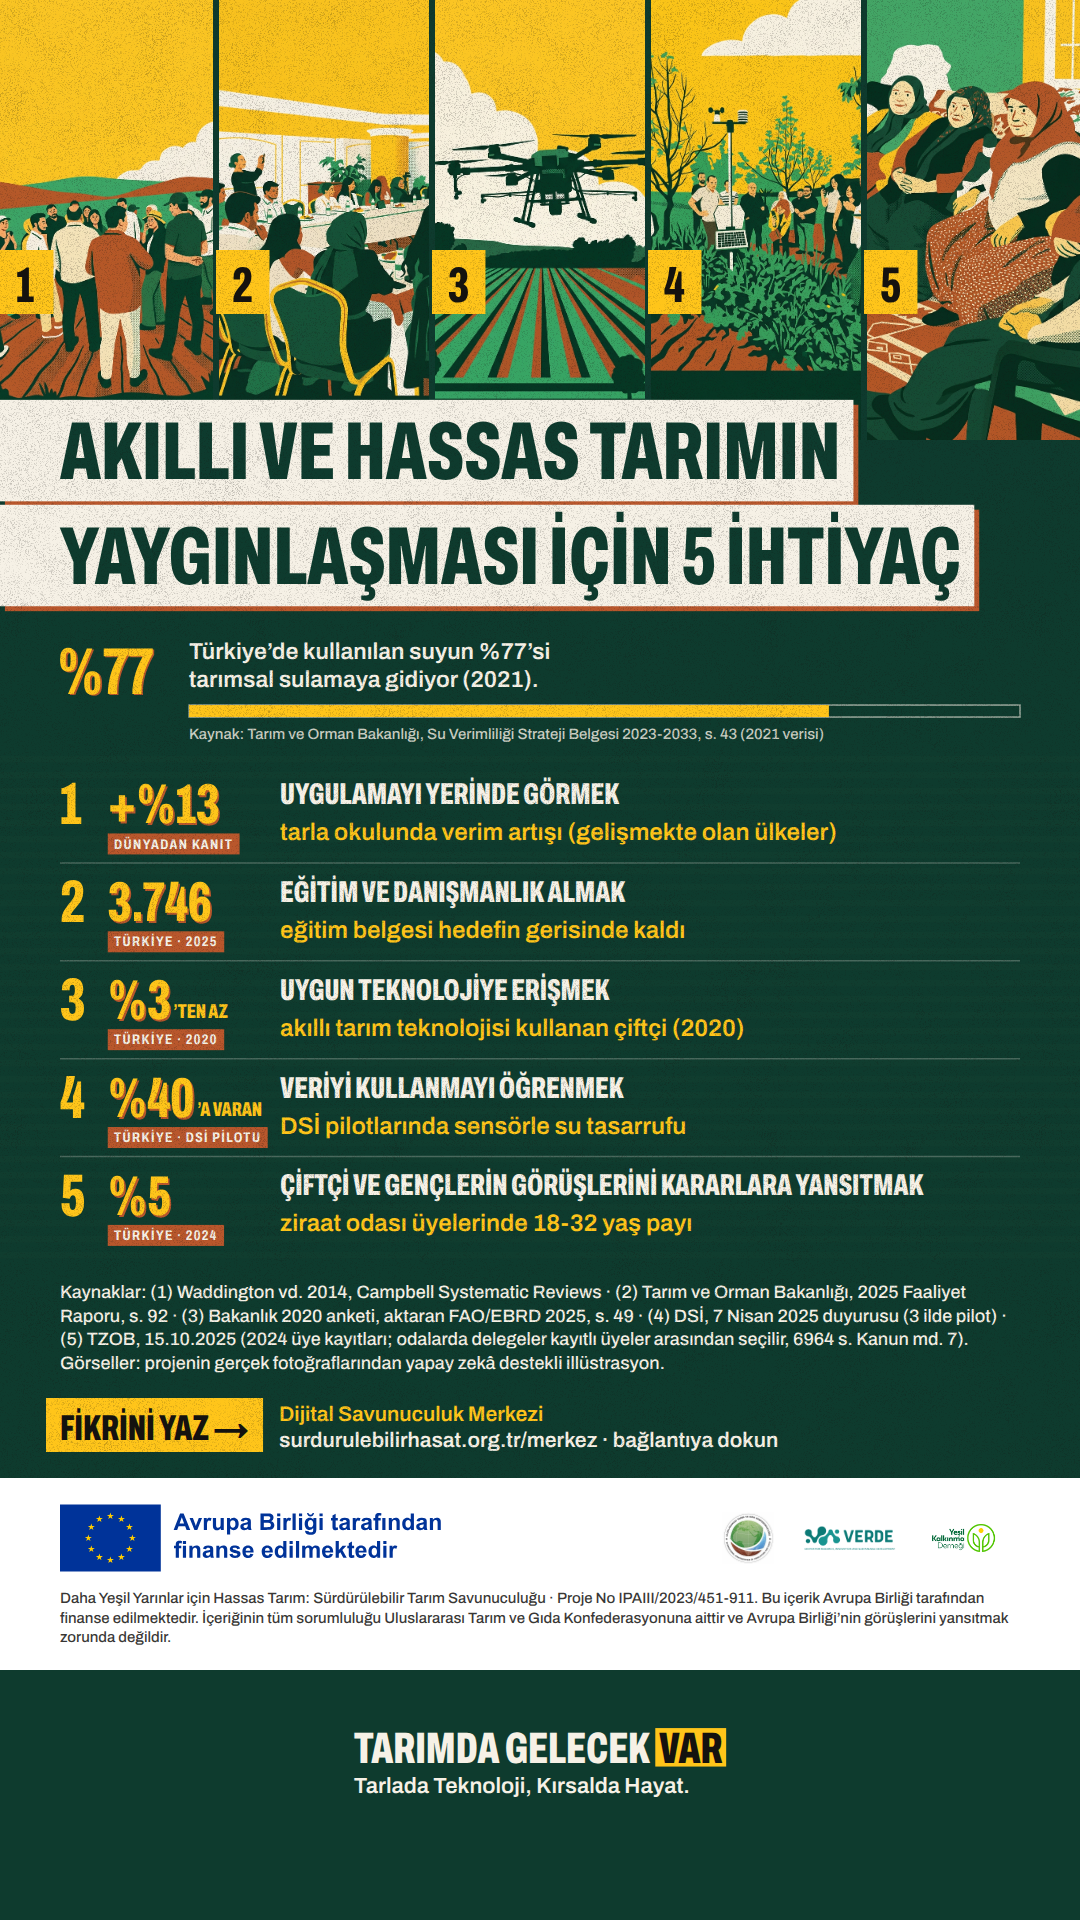
Campaign infographic: 5 Needs for Smart and Precision Farming to Spread

TARIMKON Proje Ekibi
16 October 2026 · 2 min read · 39 views
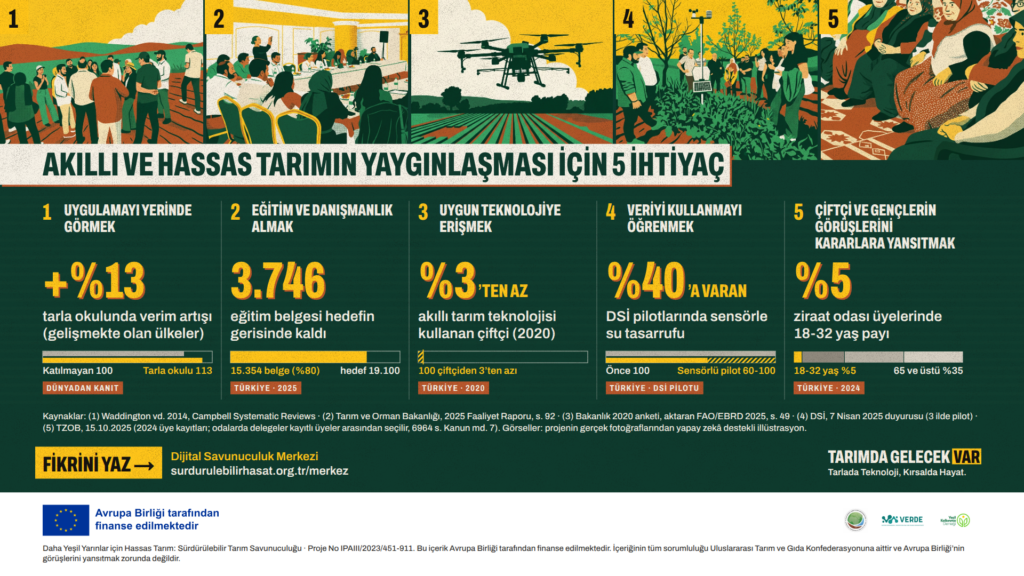
The infographic of "The Future Is in Farming" campaign (Activity 20): five needs for smart and precision farming to spread, each with a sourced figure. The designs are in Turkish.
- Seeing the practice on site: +13%. In developing countries, farmers who took part in Farmer Field Schools harvested 13% more than farmers in comparison groups in the short term, on average across 11 studies. Source: Waddington et al. (2014), Campbell Systematic Reviews 2014:6.
- Getting training and advice: 80%. According to the Ministry of Agriculture and Forestry's 2025 activity report, the number of certificates issued at the end of farmer training reached only 80% of the target (15,354 / 19,100; 3,746 short). Source: Ministry of Agriculture and Forestry, 2025 Annual Activity Report, p. 92.
- Access to suitable technology: less than 3%. In 2020, less than 3% of farmers used smart farming technologies such as sensors, remote sensing and precision agriculture. Source: Ministry of Agriculture and Forestry 2020 survey, cited in FAO/EBRD (2025), Digital technologies for agriculture in Türkiye, p. 49.
- Learning to use data: up to 40%. State Hydraulic Works (DSİ) reported water savings of up to 40% in its sensor-based irrigation automation pilots in Adana, Afyonkarahisar and Denizli. Source: DSİ news item, 7 April 2025.
- Bringing the views of farmers and young people into decisions: 5%. Delegates in the chambers of agriculture, farmers' statutory professional organisations, are elected from among registered members (Law No. 6964, Art. 7); in 2024 only 5% of these members were aged 18-32, and 35% were 65 or older. Source: Union of Turkish Chambers of Agriculture (TZOB), press release for World Women Farmers' Day, 15 October 2025.
The institution, document, address and verbatim wording behind every figure are in the Sources document (PDF, in Turkish); each figure was checked again against its source in a separate verification.
Data cards
One figure, one chart and one image for each need. They can be shared on social media as a carousel post.
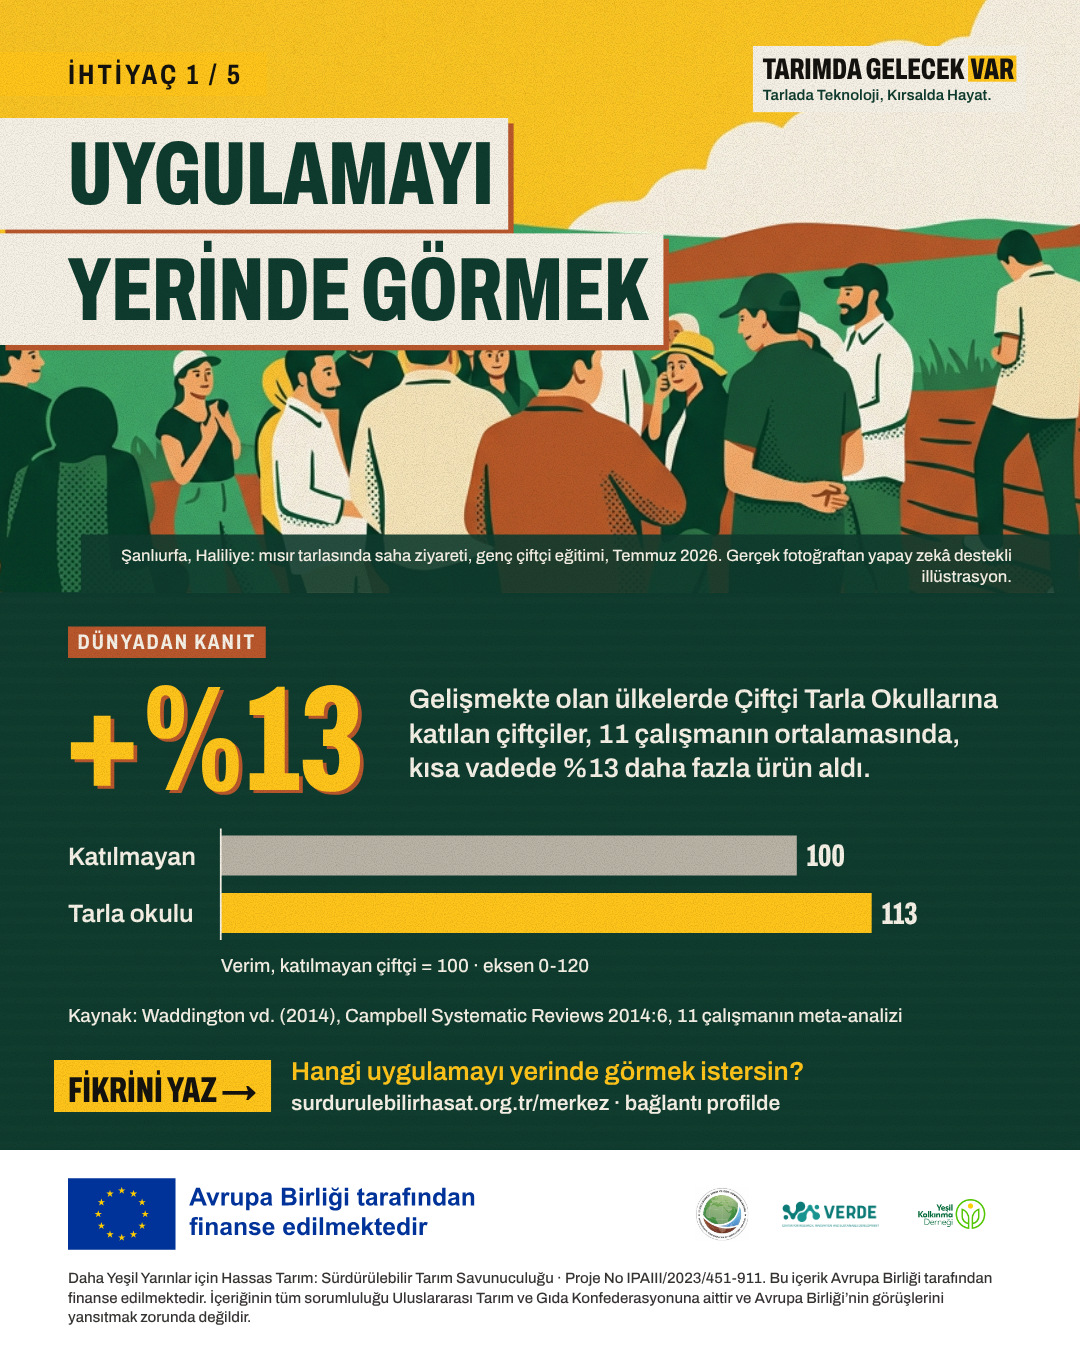
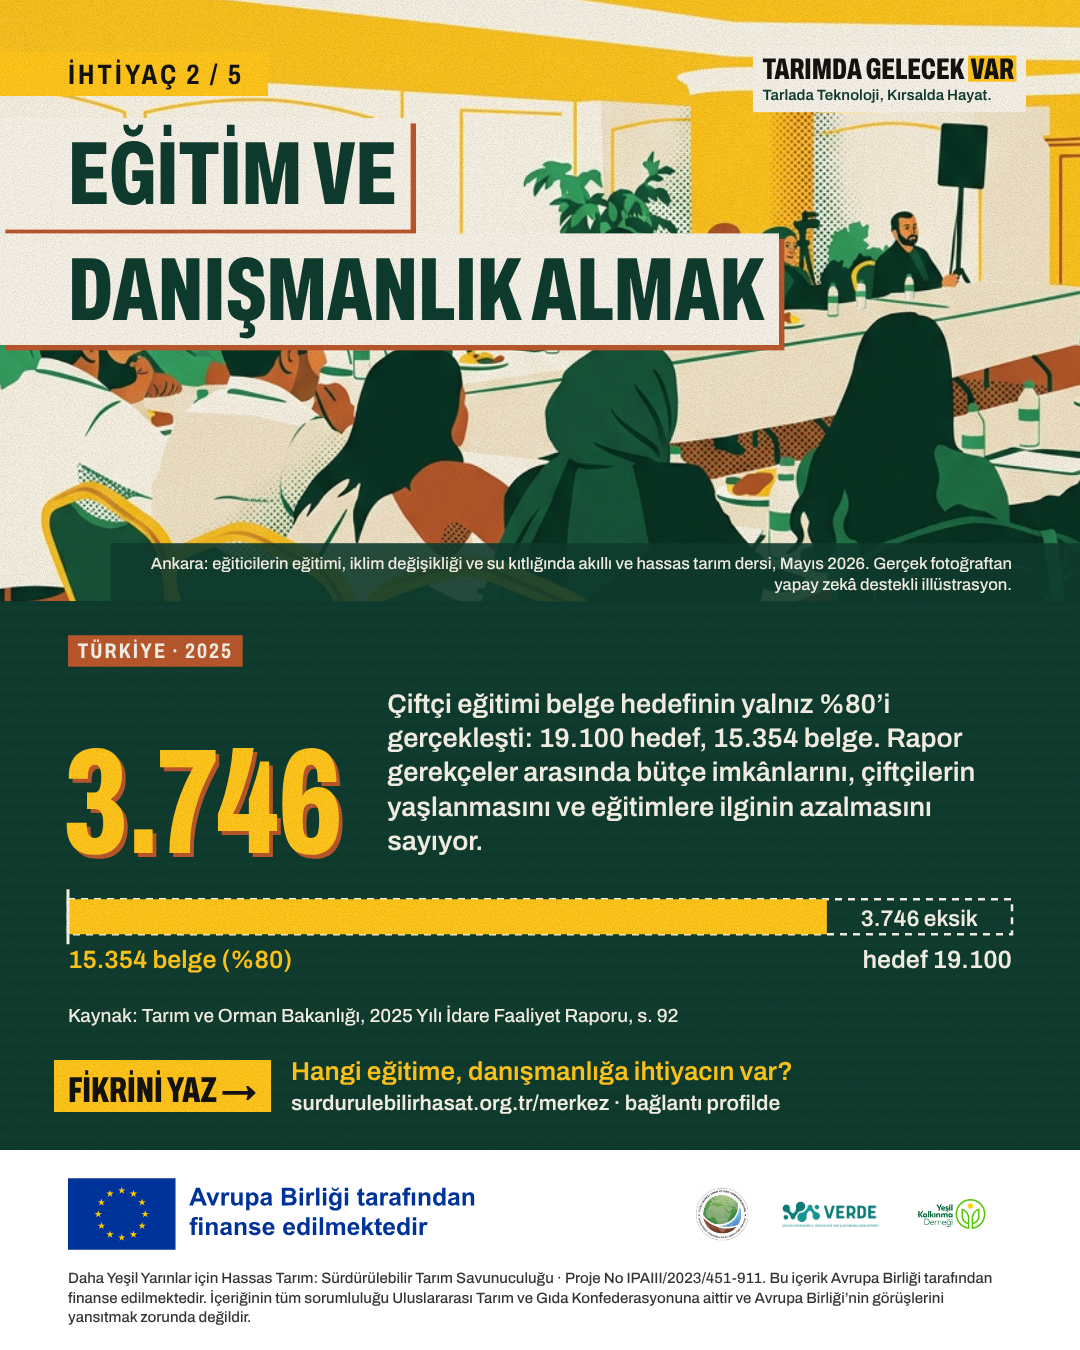
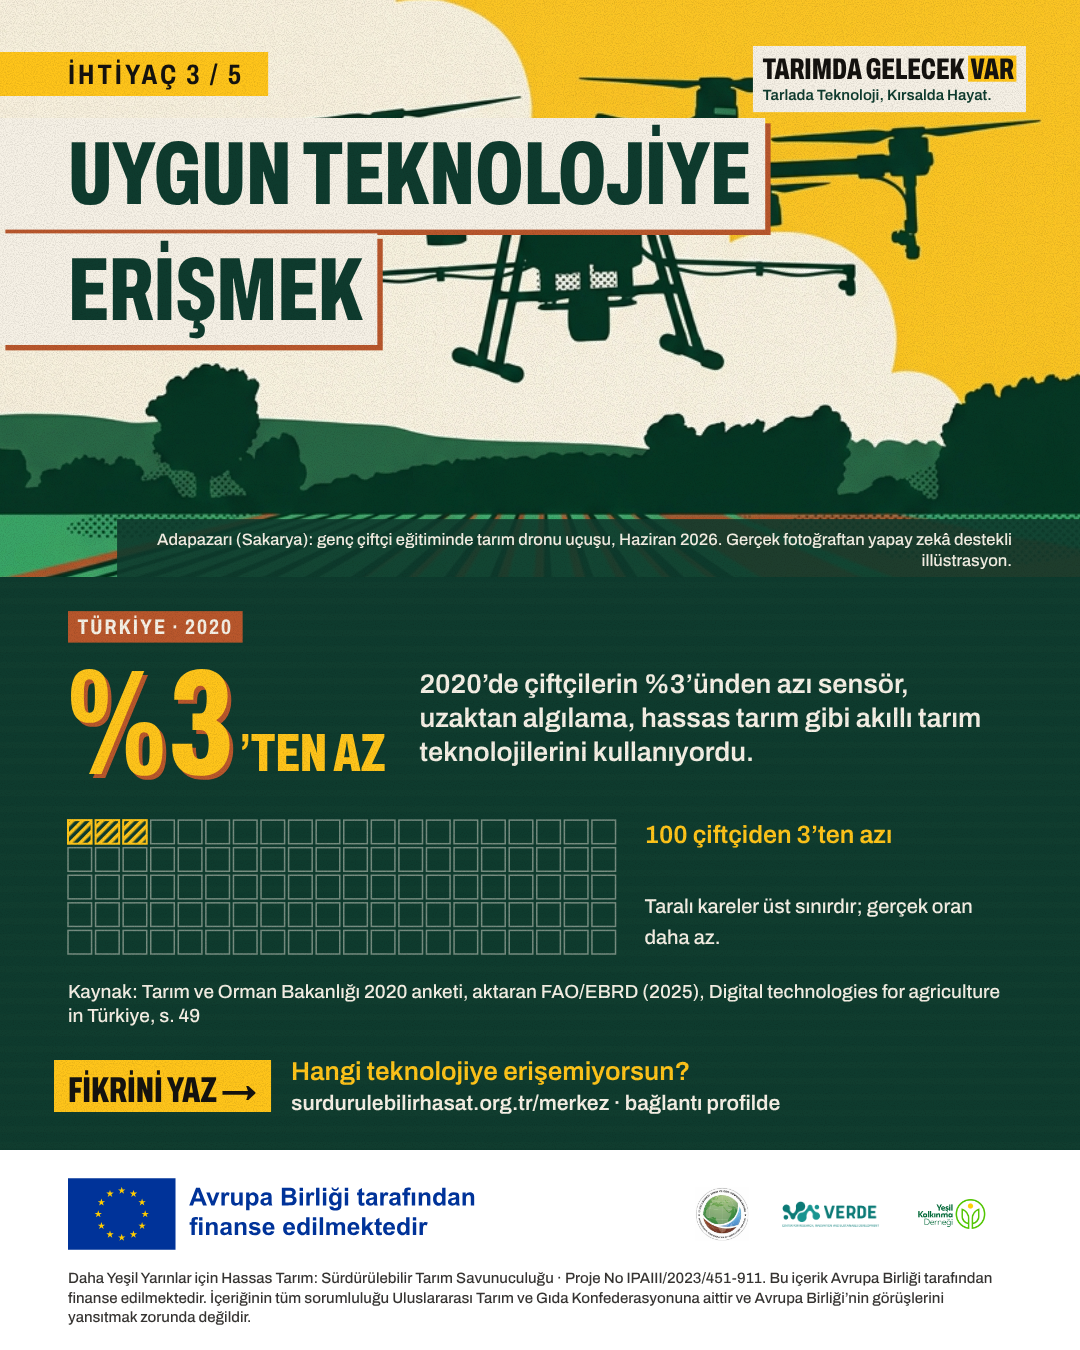
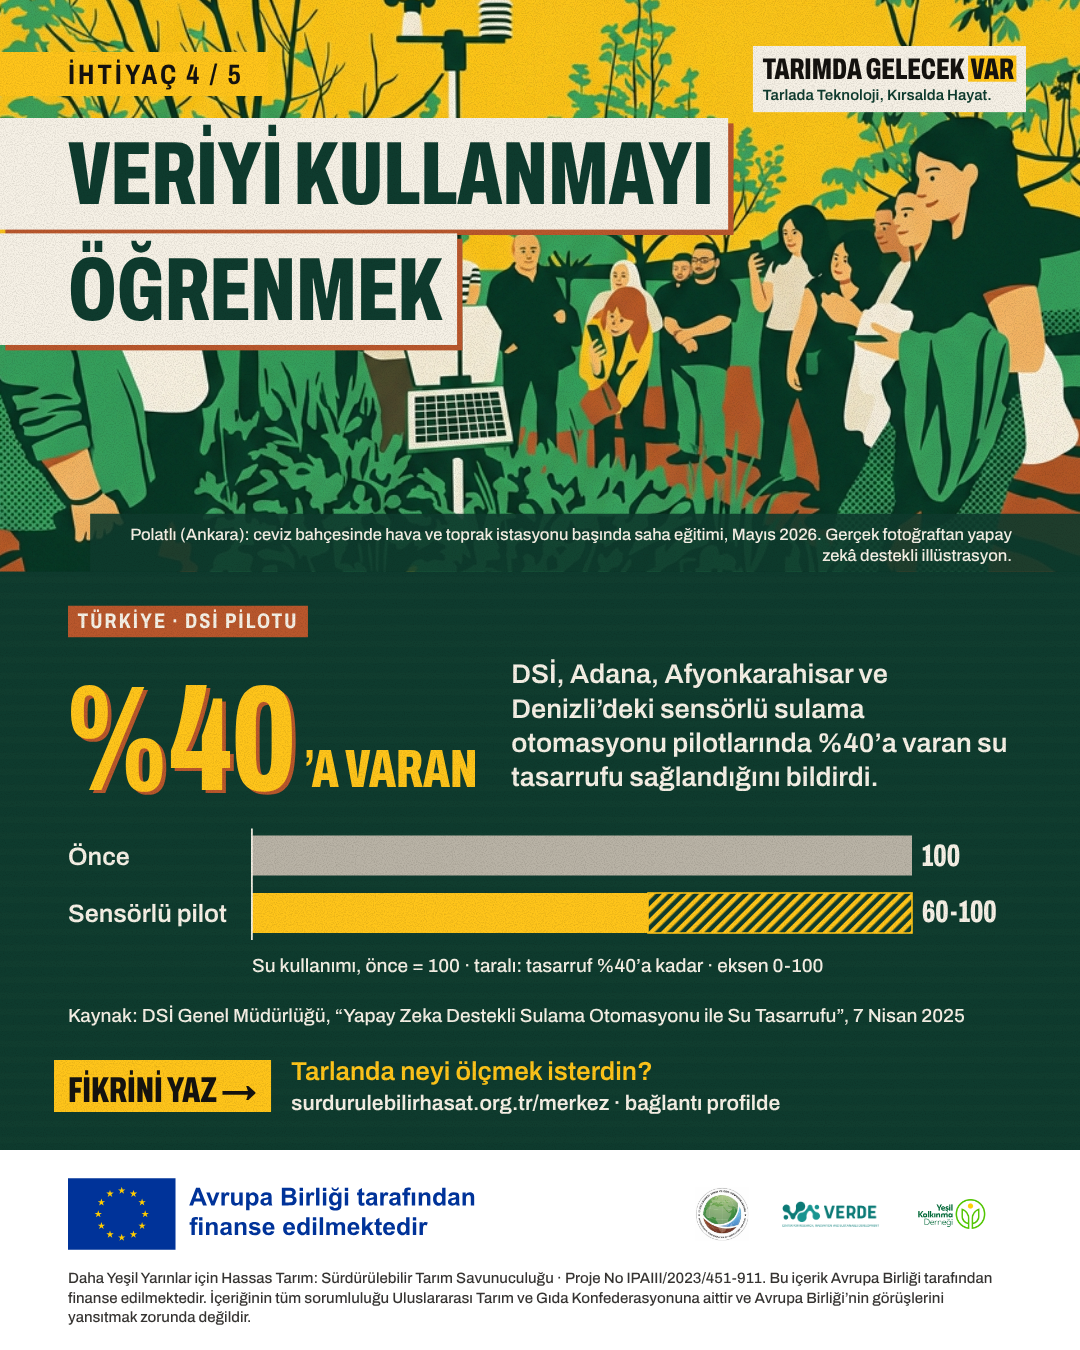
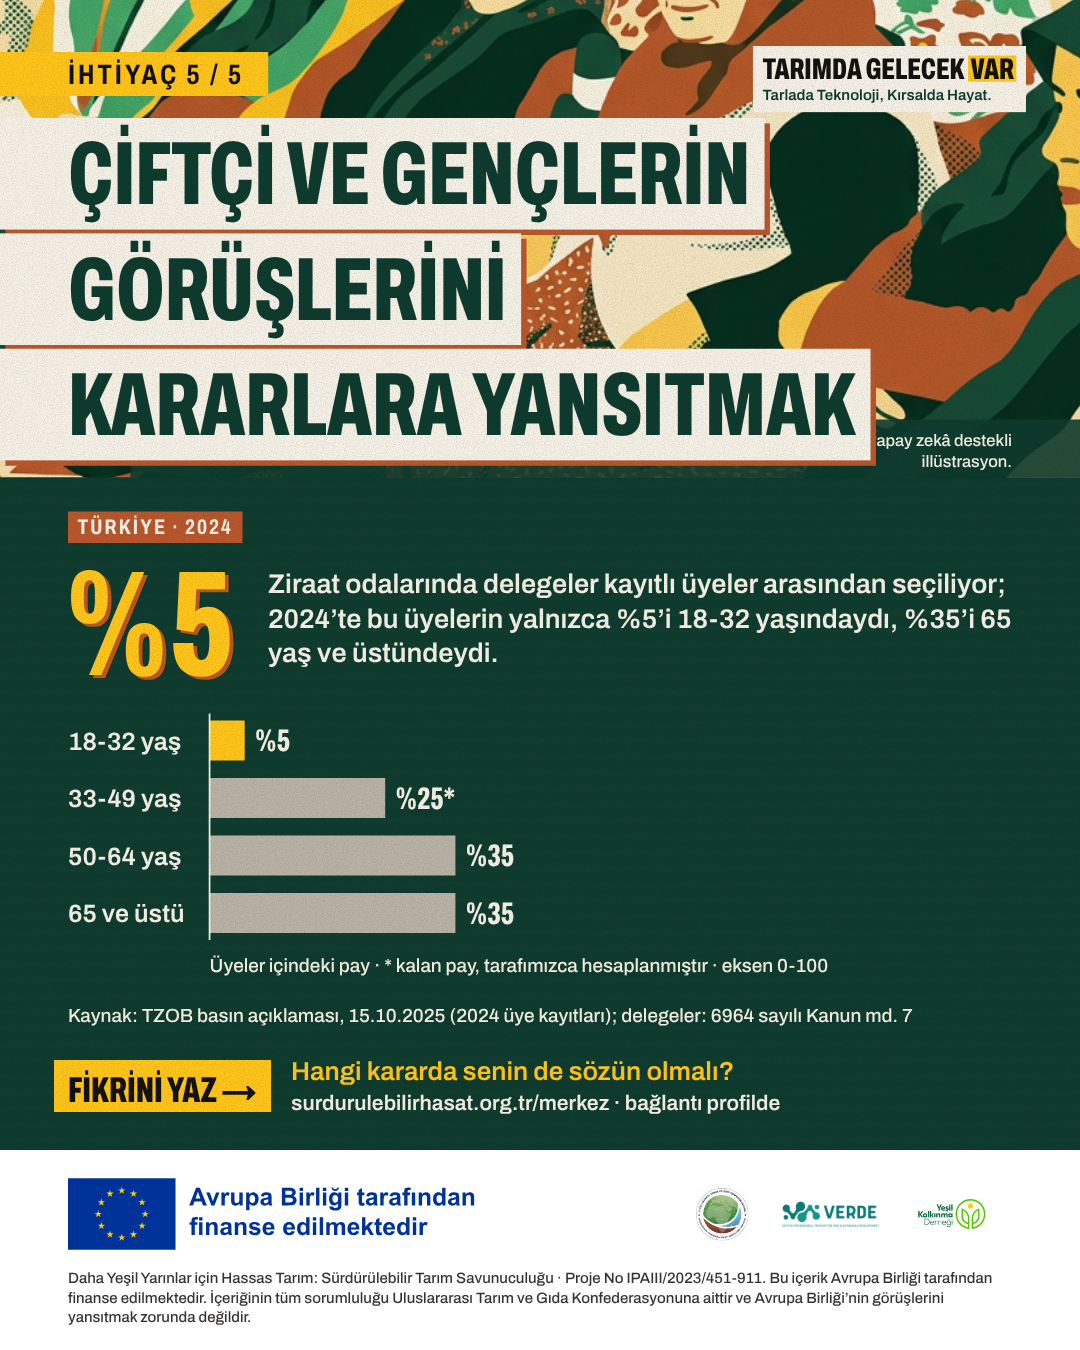
The illustrations in the infographic and data cards were prepared with the help of artificial intelligence from real, published photographs of project events; no one who was not there was added. The place and date are written under each image.